[KVA] ICT Dealing rangesNaive aproach of Dynamic Detection of Dealing Ranges:
The script dynamically identifies dealing ranges based on sequences of upward or downward price movements. It uses arrays to track the highest highs and lowest lows after detecting two consecutive up or down bars, a fundamental step towards understanding market structure and potential shifts in momentum.
ICT Concept: Order Blocks & Fair Value Gaps. This aspect can be linked to the identification of order blocks (bullish or bearish) and fair value gaps. Order blocks are essentially the last bearish or bullish candle before a significant price move, which this script could approximate by identifying the highs and lows of potential reversal zones.
Red and Green Ranges for Bullish and Bearish Movements:
The script separates these movements into red (bearish) and green (bullish) ranges, effectively categorizing potential areas of selling and buying pressure.
ICT Concept: Liquidity Pools. Red ranges could be indicative of areas where selling might occur, potentially leading to liquidity pools below these ranges. Conversely, green ranges might indicate potential buying pressure, with liquidity pools above. These areas are critical for ICT traders, as they often represent zones where price may return to "hunt" for liquidity.
Horizontal Lines for High and Low Points:
The indicator draws horizontal lines at the high and low points of these ranges, offering visual cues for significant levels.
ICT Concept: Breaker Blocks & Mitigation Sequences. The high and low points of these ranges can be seen as potential breaker blocks or areas for future mitigation sequences. In ICT terms, breaker blocks are areas where institutional orders have overwhelmed retail stop clusters, creating potential entry points for trend continuation or reversal. The high and low points marked by the indicator could serve as references for these sequences, where price might return to retest these levels.
Customizability and Historical Depth:
With inputs like rangePlot and maxBarsBack, the indicator allows for customization of the number of ranges to display and how far back in the chart history it looks to identify these ranges. This flexibility is crucial for tailoring the analysis to different trading strategies and timeframes.
ICT Concept: Market Structure Analysis. The ability to adjust the depth and number of ranges plotted caters to a detailed market structure analysis, an essential component of ICT methodology. Traders can adjust these parameters to better understand the distribution of buying and selling pressure over time and how actions have shaped price movements.
Search in scripts for "market structure"

Candle volume analysis The indicator is designed for traders who are more interested in market structures and price action using volumes. Volume analysis can help traders build a clearer understanding of zones of buyer and seller interest, as well as places to capture liquidity (traders' stop levels).
Key Features:
The indicator highlights candle volumes in selected colors, where the volume is greater individually than the volumes of the trader's chosen number of preceding candles. Or the volume that is greater than the sum of volumes of the trader's chosen number of preceding candles.

Fibonacci Oscillator (Expo)█ Overview
The Fibonacci Oscillator is a multi-faceted oscillator designed to provide traders with a comprehensive understanding of market trends and retracement points. Built on the Fibonacci ratios, it combines the functionalities of popular oscillators like RSI and MACD with unique insights into the market structure. This oscillator not only helps identify trend direction but also pinpoints overbought and oversold levels, making it an essential tool for various trading strategies.
█ How to Use
Identify Trends
Use the oscillator to identify the direction of the market trend.
Identify Retracements
Use the oscillator to identify the retracements.
█ Settings
Fibonacci Settings
These settings let you customize the Fibonacci level to focus on, thereby allowing you to tailor the oscillator according to your trading preferences.
Oscillator Settings
You can also choose between different oscillator types (RSI, MACD, Histogram) and adjust their respective settings like lengths, signals, and colors.
-----------------
Disclaimer
The information contained in my Scripts/Indicators/Ideas/Algos/Systems does not constitute financial advice or a solicitation to buy or sell any securities of any type. I will not accept liability for any loss or damage, including without limitation any loss of profit, which may arise directly or indirectly from the use of or reliance on such information.
All investments involve risk, and the past performance of a security, industry, sector, market, financial product, trading strategy, backtest, or individual's trading does not guarantee future results or returns. Investors are fully responsible for any investment decisions they make. Such decisions should be based solely on an evaluation of their financial circumstances, investment objectives, risk tolerance, and liquidity needs.
My Scripts/Indicators/Ideas/Algos/Systems are only for educational purposes!

Liquidity Candles with Prev Day High/Low and Midnight OpenAlright, let's talk about how to use this fancy indicator. But first, let me warn you, using indicators is like driving a car, you can't just press the gas pedal and hope for the best. You need to know what you're doing, or else you'll crash and burn faster than a soufflé in a microwave.
Now, let's get started. The first thing you need to do is understand what this indicator is telling you. Think of it like a signalman at a train station. He's waving flags and giving hand signals to tell you whether it's safe to proceed or if you need to stop and wait. This indicator works the same way.
It's going to give you signals based on price movements, telling you whether it's safe to buy or sell. But don't get too excited, my friend. You still need to use your brain and make smart decisions. Don't just blindly follow the signals, or else you'll end up like a sheep being led to the slaughter.
Now, let's talk about some of ICT's smart money trading concepts. First up, we have "liquidity grabs". This is when the big boys in the market create false breakouts to shake out the weak hands. They're like school bullies stealing lunch money from the little kids. But you can avoid being a victim by watching for signs of a liquidity grab, and using your brain to decide whether it's a real breakout or just a trap.
Next up, we have "stop runs". This is when the big players purposely trigger stop-loss orders to get a better entry or exit. It's like a game of chicken, but with your money on the line. To avoid being run over, keep an eye on your stop-loss orders, and don't be too predictable in your trading.
Finally, we have "market structure". This is like the blueprint of the market, showing you where the support and resistance levels are. It's like a treasure map to finding the best trades. But don't forget that market structure can change over time, so keep updating your map and stay ahead of the game.
So there you have it, my friend. A quick tutorial on using this indicator, with a side of ICT's smart money trading concepts. But remember, indicators are just tools, and you're the one driving the car. Use your brain, stay alert, and don't be a sheep. Happy trading!
Divergent Trades LLC:
Disclaimer: The information provided by the Divergent Trades LLC indicator is for educational and informational purposes only. It should not be considered financial advice or a recommendation to buy, sell, or trade any financial instrument. Divergent Trades LLC is not responsible for any losses incurred as a result of using this indicator. Trading in the financial markets carries a high level of risk and may not be suitable for all investors. Before making any investment decisions, please consult with a financial advisor and do your own due diligence. Past performance is not indicative of future results. By using the Divergent Trades LLC indicator, you acknowledge that you have read and understand this disclaimer and agree to its terms and conditions.

3 Candle Strike StretegyMainly developed for AMEX:SPY trading on 1 min chart. But feel free to try on other tickers.
Basic idea of this strategy is to look for 3 candle reversal pattern within trending market structure. The 3 candle reversal pattern consist of 3 consecutive bullish or bearish candles,
followed by an engulfing candle in the opposite direction. This pattern usually signals a reversal of short term trend. This strategy also uses multiple moving averages to filter long or short
entries. ie. if the 21 smoothed moving average is above the 50, only look for long (bullish) entries, and vise versa. There is option change these moving average periods to suit your needs.
I also choose to use Linear Regression to determine whether the market is ranging or trending. It seems the 3 candle pattern is more successful under trending market. Hence I use it as a filter.
There is also an option to combine this strategy with moving average crossovers. The idea is to look for 3 candle pattern right after a fast moving average crosses over a slow moving average.
By default , 21 and 50 smoothed moving averages are used. This gives additional entry opportunities and also provides better results.
This strategy aims for 1:3 risk to reward ratio. Stop losses are calculated using the closest low or high values for long or short entries, respectively, with an offset using a percentage of
the daily ATR value. This allows some price fluctuation without being stopped out prematurely. Price target is calculated by multiplying the difference between the entry price and the stop loss
by a factor of 3. When price target is reach, this strategy will set stop loss at the price target and wait for exit condition to maximize potential profit.
This strategy will exit an order if an opposing 3 candle pattern is detected, this could happen before stop loss or price target is reached, and may also happen after price target is reached.
*Note that this strategy is designed for same day SPY option scalping. I haven't determined an easy way to calculate the # of contracts to represent the equivalent option values. Plus the option
prices varies greatly depending on which strike and expiry that may suits your trading style. Therefore, please be mindful of the net profit shown. By default, each entry is approximately equal
to buying 10 of same day or 1 day expiry call or puts at strike $1 - $2 OTM. This strategy will close all open trades at 3:45pm EST on Mon, Wed, and Fri.
**Note that this strategy also takes into account of extended market data.
***Note pyramiding is set to 2 by default, so it allows for multiple entries on the way towards price target.
Remember that market conditions are always changing. This strategy was only able to be back-tested using 1 month of data. This strategy may not work the next month. Please keep that in mind.
Also, I take no credit for any of the indicators used as part of this strategy.
Enjoy~

Session Levels - Ultimate Range IndicatorSession Levels - Ultimate Range Indicator
Primarily developed for trading the E-MINI Futures Markets like NQ or ES from the CME Group,
but also more than suitable for Crypto or other instruments.
This indicator highlights the chosen session, which can be Globex, Asian, London and New York.
It plots the important levels and also renders the Opening Range as it forms (a.k.a. Initial Balance).
After the 1st hour Opening Range is finished, it can plot the Standard Deviations / Projections.
See below for a complete feature list.
All Opening Ranges on chart and for the New York session the Range Projections are turned on:
s3.tradingview.com
How to use (example):
If you are trading the Nasdaq Futures (NQ!)
Enable the Globex Overnight session. Basically in the Futures Market, the Globex session is everything outside of US trading hours of Stocks. This draws the important overnight levels, like the Low, 25%, 50%, 75% and the High.
Enable the New York Session with Levels and Opening Range. Generally, 70% of the time the 1st hour will put a Low or High of the day.
If the price is trading above the Globex Low, most likely the Low of the Day is formed and the price target for the day will be 1.5x Standard Deviation and 2x Standard Deviation.
[*} Deviation of the Initial Balance depends on the volume ad overall market structure.
** This is not financial advice or any guarantee **
Features:
Show each Session Highlighted on Intraday chart in it's own color (each session can be turned off and has customizable times and color)
Show Line Levels of each session: Low, 25%, 50%, 75% and the High (customizable color)
Show the Opening Range (Initial Balance) of the Asian, London and New York session. Note: NY has more options.
Opening Range is displayed as a box with level lines (customizable color)
Levels are drawn to the end of the NY Cash session (customizable time)
Show IB Standard Deviations 0.5 - 3.0. Calculated from the Opening Range (Initial Balance)
Option to display Higher Timeframe levels: Previous Day Open/Close and Previous Week Open/Close
All level lines and OR boxes size dynamically as the session progresses
Built in Alerts for when price hits key levels. e.g. Alert when price crosses the NY Opening Range High. Or an Alert when the first STDEV is hit.
Option to toggle display of drawings for Today's trading session only, or Show all recent session levels. This keeps the chart clean or not.
Extras:
The NY Opening Range also has a 50% level line
The NY Opening Bar can be highlighted separately
The Level Lines can have small labels turned on/off. Values are only shown on mouse over to keep a clean chart
Keep in mind:
1) This indicator works on all instruments, but on instruments with limited market hours, your chart setting
has to be set to "Extended Hours" otherwise. For example TSLA on NASDAQ.
2) The Exchange Time Zone for the CME Group is Chicago UTC-6. So the session times you configure in the settings menu are based on that timezone too.
3) Globex opens at 5pm CST and closes when the US session starts 8:30CST.
4) When enabling the Alerts in the Indicator settings, be sure to also create an alarm for this indicator using the Alarm function of Tradingview.

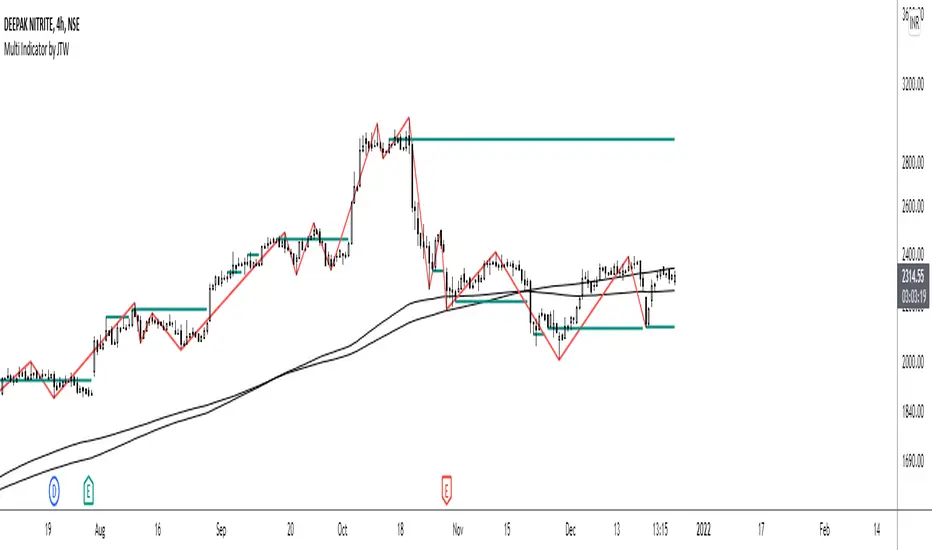
Multi-Indicator by johntradingwickThe Multi-Indicator includes the functionality of the following indicators:
1. Market Structure
2. Support and Resistance
3. VWAP
4. Simple Moving Average
5. Exponential Moving Average
Functionality of the Multi-Indicator:
Market Structure
As we already know, the market structure is one of the most important things in trading. If we are able to identify the trend correctly, it takes away a huge burden. For this, I have used the Zig Zag indicator to identify price trends. It plots points on the chart whenever the prices reverse by a larger percentage than a predetermined variable. The points are then connected by straight lines that will help you to identify the swing high and low.
This will help you to filter out any small price movements, making it easier to identify the trend, its direction, and its strength levels. You can change the period in consideration and the deviation by changing the deviation % and the depth.
Support and Resistance
The indicator provides the functionality to add support and resistance levels. If you want more levels just change the timeframe it looks at in the settings. It will pull the SR levels off the timeframe specified in the settings.
You can select the timeframe for support and resistance levels. The default time frame is “same as the chart”.
You can also extend lines to the right and change the width and colour of the lines. There is also an option to change the criteria to select the lines as valid support or resistance. You can extend the S/R level or use the horizontal lines to mark the level when there is a change in polarity.
VWAP
Volume Weighted Average Price (VWAP) is used to measure the average price weighted by volume. VWAP is typically used with intraday charts as a way to determine the general direction of intraday prices. It's similar to a moving average in that when the price is above VWAP, prices are rising and when the price is below VWAP, prices are falling. VWAP is primarily used by technical analysts to identify market trend.
Simple Moving Average
A simple Moving Average is an unweighted Moving Average. This means that each day in the data set has equal importance and is weighted equally. As each new day ends, the oldest data point is dropped and the newest one is added to the beginning.
The multi-indicator has the ability to provide 5 moving averages. This is particularly helpful if you want to use various time periods such as 20, 50, 100, and 200. Although this is just basic functionality, it comes in handy if you are using a free account.
Exponential Moving Average
An exponential moving average (EMA) is a type of moving average (MA) that places a greater weight and significance on the most recent data points. An exponentially weighted moving average reacts more significantly to recent price changes than a simple moving average. The multi-indicator provides 5 exponential moving averages. This is particularly helpful if you want to use various time periods such as 20, 50, 100, and 200.
Higher Order PivotsFirst order pivot points are defined as 3 or 5 bar "V" shaped patterns. For example a high with a lower high either side of the peak and in the case of the 5 bar variant with lower highs adjacent to a high below the peak.
Second order pivot points are defined by three first order pivots in the same manner. For example a peak pivot high with a lower pivot high to either side.
Third order pivots follow the same pattern, a peak second order pivot high with two adjacent second order pivot highs.
As it can take a significant and variable amount of time before higher order pivots are confirmed, it is generally inadvisable to use higher order pivots for live trading!
However they can be used for historical analysis. For example to delineate market structure of major market inflections.
For example :
Delineating market structure using 2nd order pivots derived from 3 bar, 1st order pivots
Major market inflections from 3rd order pivots derived from 5 bar, 1st order pivots

TM_INTRADAY_TOOLTM_INTRADAY_TOOL helps to identify following Things for Intraday Position on 1-3-5-10-15-30-60 Minutes and Daily timeframe along with Buy or sell signal.
1. Market Trend (Different Timeframe)
2. Price Direction
3. Area of Support & Resistance
4. Price Momentum
5. Volume Based Breakouts
Terminology Use ==> Black from Bottom for - Buy, Red from Top for - Sale Signal, and Numbers are to show time frame indication there is presence of buyer or seller like 1 for buy signal on 1 minute time frame etc.
Display and Interpretation ==> Buy Sale Signal in Digit with 1-3-5-10-15-30-60-D for different time frames.
any value signal ending with * shows breakout of support/ resistance and value signal starting with * shows entry to a momentum zone.
Green Mark with Triangle Up shows trend of that timeframe in positive and value shows upside possible direction on that timeframe vice versa for red signal with down triangle
T1 stand for trend change in 1 Minute timeframe and T3 stand for trend change in 3 Minute timeframe
Use market structure, chart pattern, trend lines for more support..
Time frame ==> Use proper Signal with 1 minute, 3 minute time frame
What to Identify ==> Overall Trend for the intraday
How to Use ==>
See how and order buildup is seen and current order position. Also area for volatility and expected movement in price direction
Note: - Use market structure, chart pattern, trend lines and price action parameter for more confirmation.
Entry ==>
Let’s wait the proper area of support or resistance ( Area of Value in case of trend pattern use)
Exit ==>
SL of swing high/low out of market structure with proper risk management and target with proper Risk/ Reward Ratio
Use the Below Contacts to Access this Indicator

Cycle Forecast + MACD Divergence (Kombi v6 FULL)This indicator merges two powerful analytical models:
🔮 1. Dominant Cycle Forecasting
The script automatically identifies major structural market cycles by detecting significant swing highs and lows.
It then fits a sinusoidal wave (amplitude, phase, and period) to the dominant cycle and projects it into the future.
Features:
Automatically extracts large, dominant cycles (no noise, no small swings)
Smooth sinusoidal historical cycle visualization
Future cycle projection for 1–2 upcoming cycle periods
Dynamic amplitude and phase alignment based on market structure
Helps anticipate cycle tops and bottoms for long-term timing
📉 2. MACD Divergence Detection
Full divergence detection engine using MACD or MACD Histogram.
Detects:
Bullish Divergence
Price ↓ while MACD (or Histogram) ↑
→ Possible trend reversal upward
Bearish Divergence
Price ↑ while MACD (or Histogram) ↓
→ Possible trend reversal downward
Features:
Pivot-based divergence confirmation (no repaint)
Choice of MACD Line or Histogram as divergence source
Labels + connecting divergence lines
Works across all markets and timeframes
⚙️ Smart Auto-Pivot System
The indicator optionally adjusts pivot sensitivity based on timeframe:
Weekly → tighter pivots
Daily → medium pivots
Intraday → wider pivots
Ensures stable, meaningful divergence signals even on higher timeframes.
🎯 Use cases
Identify upcoming cycle highs/lows
Spot major trend reversals early
Improve swing entries with MACD divergences near cycle turns
Combine forecasting with momentum exhaustion
Suitable for crypto, stocks, indices, forex & commodities
🧠 Why this indicator is powerful
This tool blends time-based cycle forecasting with momentum-based divergence signals, giving you a unique perspective of where the market is likely to turn.
Cycles reveal when a move may occur.
Divergences reveal why a move may occur.
Combined, they offer highly effective market timing.

Elite Commodities AIThe Elite Commodities AI indicator provides a comprehensive analytical framework designed specifically for commodities trading. It combines multiple technical components to assess price action within the unique characteristics of commodity markets.
The indicator incorporates the following key elements:
Multi-timeframe RSI analysis across the primary timeframe, 4-hour, and daily periods
Multiple exponential moving averages (fast, slow, and trend) to establish directional context
Volume rate analysis measuring current volume relative to recent average volume
Bollinger Band width analysis to identify periods of volatility contraction
True Range volatility expressed as a percentage of price
The indicator evaluates the interaction between momentum, trend structure, volume participation, and volatility dynamics, which are particularly significant in commodities markets due to their sensitivity to changes in supply-demand fundamentals and large institutional order flow.
By combining these analytical components, the indicator provides a layered assessment of price behavior that captures the interplay between trend development, momentum characteristics, participation levels, and volatility compression—key factors that drive commodity market movements.
This approach enables traders to identify significant price action within the context of prevailing market structure, making it suitable for analyzing both directional trends and consolidation periods that are common in commodity price behavior.2.2s

🤖 DarkPool's Omni-MA APEX v3 🤖DarkPool's Omni-MA APEX v3 is an all-encompassing technical analysis suite designed to replace multiple indicators with a single, highly optimized tool. At its core, it features five independently customizable "Omni-MAs" capable of running various calculation models (SMA, EMA, HMA, LSMA, etc.) across multiple timeframes.
Beyond standard trend lines, the APEX v3 integrates a sophisticated "Market Structure Engine" that automatically plots Support & Resistance zones based on pivot points and volatility (ATR). It also features a "Trend Cloud" to visualize macro sentiment and a professional-grade Dashboard that aggregates data from over 10 different sources (RSI, MACD, OBV, Volume, etc.) to provide a real-time health check of the asset.
Key Features
5-Layer Omni-MA System: Five distinct moving averages with "Smart Coloring" that detects trends, consolidations (flat markets), and reversals.
Auto Support & Resistance: A dynamic algorithm that draws, updates, and prunes liquidity zones on the chart automatically.
Macro Trend Cloud: A visual background fill comparing Daily and Weekly momentum to keep you aligned with the higher timeframe.
Data Dashboard: A customizable panel displaying real-time metrics for Momentum, Volume, RSI, Divergences, and VWAP status.
Signal Generator: Alerts for MA crossovers, S/R breakouts, and trend shifts.
How to Use
1. The Omni-MAs (The Lines) The indicator plots up to five lines, color-coded for instant trend recognition:
Green/Blue: Price is above the previous value (Uptrend).
Red/Maroon: Price is below the previous value (Downtrend).
Gray: The line is flat (Consolidation/Chop).
MA 1-2 (Fast): Use these for entry triggers and scalping.
MA 3 (Medium): The "Anchor" line, often used as dynamic support.
MA 4-5 (Slow): The macro trend filters. If price is below MA 5, looking for longs is risky.
2. The Trend Cloud
Background Fill: This visualizes the difference between the Daily EMA and Weekly EMA.
Green Cloud: The Daily trend is above the Weekly trend (Strong Bullish Market).
Red Cloud: The Daily trend is below the Weekly trend (Strong Bearish Market).
3. Support & Resistance Zones
The Boxes: The script identifies pivot points and projects them forward as boxes.
Strategy: Watch for price to react at these zones. If a candle closes through a zone, it signals a Breakout (Green triangle) or Breakdown (Red triangle).
4. The Dashboard Located in the corner of your chart, this table provides a "Cockpit View" of the market:
Momentum Score: A composite score (-100 to +100) derived from RSI, MACD, and Stochastic.
Vol Ratio: Compares current volume to the average. A green bar indicates volume is higher than usual.
Market State: Classifies the market into regimes like "Volatile Bull," "Quiet Bear," or "Ranging."
Configuration Settings
Dashboard UI
Compact Mode: Reduces the table to show only the final Buy/Sell signal.
Active Widgets: Toggle individual data points (e.g., turn off "OBV" or "ADX" if you don't use them) to save screen space.
Global Analysis (Strategy Engine)
ATR Filter: Filters out "Weak" trends. If the price movement is too small (low volatility), signals are suppressed.
Volume MA: Sets the lookback period for calculating relative volume.
Support & Resistance
Pivot Sensitivity: Lower numbers find more zones (more noise); higher numbers find fewer, stronger zones.
Zone Width: Multiplies the ATR to determine how thick the S/R boxes should be.
MA Settings (1-5)
Type: Choose from SMA, EMA, WMA, HMA (Hull), VWMA, LSMA, ALMA, and more.
Timeframe: You can set MA 5 to "D" (Daily) while trading on a 15-minute chart to see the daily trend line overlaid.
Disclaimer This indicator is provided for educational and informational purposes only. It does not constitute financial advice, investment recommendations, or a guarantee of future results.

Bollinger Bands HTF Hardcoded (Len 20 / Dev 2) [CHE]Bollinger Bands HTF Hardcoded (Len 20 / Dev 2) — Higher-timeframe BB emulation with bucket-based length scaling and on-chart diagnostics
Summary
This indicator emulates higher-timeframe Bollinger Bands directly on the current chart by scaling a fixed base length (20) via a timeframe-to-bucket multiplier map. It avoids cross-timeframe requests and instead applies the “HTF feel” by using a longer effective lookback on lower timeframes. Bands use the classic deviation of 2 and the original color scheme (Basis blue, Upper red, Lower green, blue fill). An on-chart table reports the resolved bucket, multiplier, and effective length.
Pine version: v6
Overlay: true
Primary outputs: Basis (SMA), Upper/Lower bands, background fill, optional info table
Motivation: Why this design?
Cross-timeframe Bollinger Bands typically rely on `request.security`, which can introduce complexity, mixed-bar alignment issues, and potential repaint paths depending on how users consume signals intrabar. This design offers a deterministic alternative: a single-series calculation on the chart timeframe, with a hardcoded “HTF emulation” achieved by scaling the BB length according to coarse higher-timeframe buckets. The result is a smoother, slower band structure on low timeframes without external timeframe calls.
What’s different vs. standard approaches?
Baseline: Standard Bollinger Bands with a fixed user length on the current timeframe, or true HTF bands via `request.security`.
Architecture differences:
Fixed base parameters: Length = 20, Deviation = 2.
Bucket mapping derived from the chart timeframe (or manually overridden).
No `request.security`; all computations occur on the current series.
Effective length is “20 × multiplier”, where multiplier approximates aggregation into the chosen bucket.
Diagnostics table for transparency (bucket, multiplier, resolved length, bandwidth).
Practical effect: On lower timeframes, the effective length becomes much larger, behaving like a higher-timeframe Bollinger structure (smoother basis and wider stability), while remaining purely local to the chart series.
How it works (technical)
The script first resolves a target bucket (“Auto” or a manual selection such as 60/240/1D/…/12M). It then computes a multiplier that approximates how many current bars fit into that bucket (e.g., 1m→60m uses mult≈60, 5m→60m uses mult≈12). The effective Bollinger length becomes:
`bb_len = 20 mult` (clamped to at least 1)
Using the effective length, it calculates:
`basis = ta.sma(src, bb_len)`
`dev = 2 ta.stdev(src, bb_len)`
`upper = basis + dev`
`lower = basis - dev`
A “bandwidth” diagnostic is also computed as `(upper-lower) / basis` (guarded against division by zero) and shown in the table as a percentage. A persistent table object is created/deleted based on the visibility toggle and updated only on the last bar for performance.
Parameter Guide
Source — Input series for the bands — Default: Close
Use close for classic behavior; smoother sources reduce responsiveness.
Bucket — HTF bucket selection — Default: Auto
Auto derives a bucket from the chart timeframe; manual selection forces the intended target bucket.
Offset — Plot offset — Default: 0
Shifts plots forward/back for visual alignment, displayed in the data window.
Table X / Table Y — Table anchor — Default: Right / Top
Places the diagnostics table in one of nine anchor points.
Table Size — Table text size — Default: Normal
Use small on dense charts, large for presentations.
Dark Mode — Table theme — Default: Enabled
Switches table palette for readability against chart background.
Show Table — Toggle diagnostics table — Default: Enabled
Disable for a cleaner chart.
Reading & Interpretation
Basis (blue): The moving average centerline of the bands (SMA of effective length).
Upper (red) / Lower (green): ±2 standard deviations around the basis using the same effective length.
Fill (blue tint): Visual band zone to quickly see compression/expansion.
Interpretation staples:
Price riding the upper band suggests strong bullish pressure; riding the lower band suggests strong bearish pressure.
Band expansion indicates rising volatility; contraction indicates volatility compression.
Mean reversion setups often key off the basis and re-entries from outside bands, while breakout/trend setups often key off sustained band rides.
Diagnostics table:
HTF Tag: Human-readable label showing the current timeframe → bucket mapping.
Bucket: The resolved target bucket (Auto result or manual selection).
Multiplier: The integer factor applied to the base length.
Len/Dev: Shows base length (20) and the effective length result plus deviation (2).
Bandwidth: Normalized width of the band (percent), useful for spotting squeezes.
Practical Workflows & Combinations
HTF context on LTF charts: Use this as “slow structure” bands on 1m–15m charts without requesting HTF data.
Squeeze detection: Watch bandwidth shrink to historically low levels, then look for break/hold outside bands.
Trend filtering: Favor long bias when price stays above the basis and repeatedly respects it; favor short bias when below.
Confluence: Combine with market structure (swing highs/lows), volume tools, or a trend filter (e.g., a longer MA) for confirmation.
Behavior, Constraints & Performance
Repaint/confirmation: No cross-timeframe requests. Values can still evolve intrabar and settle on close, as with any indicator computed on live bars.
History requirements: Very large effective lengths need sufficient historical bars; expect a warm-up period after loading or switching symbols/timeframes.
Known limits: Because the method approximates HTF behavior by scaling lookback, it is not identical to true HTF Bollinger Bands computed on aggregated candles. In particular, volatility and mean can differ slightly versus a real HTF series.
Sensible Defaults & Quick Tuning
Default workflow:
Bucket: Auto
Source: Close
Table: On (until you trust the mapping), then optionally off
If bands feel too slow on your timeframe: choose a smaller bucket (e.g., 60 instead of 240).
If bands feel too reactive/noisy: choose a larger bucket (e.g., 1D or 3D).
If chart looks cluttered: hide the table; keep only the bands and fill.
What this indicator is—and isn’t
This is a Bollinger Band visualization layer that emulates higher-timeframe “slowness” via deterministic length scaling. It is not a complete trading system and does not include entries, exits, sizing, or risk management. Use it as context alongside your execution rules and protective stops.
Disclaimer
The content provided, including all code and materials, is strictly for educational and informational purposes only. It is not intended as, and should not be interpreted as, financial advice, a recommendation to buy or sell any financial instrument, or an offer of any financial product or service. All strategies, tools, and examples discussed are provided for illustrative purposes to demonstrate coding techniques and the functionality of Pine Script within a trading context.
Any results from strategies or tools provided are hypothetical, and past performance is not indicative of future results. Trading and investing involve high risk, including the potential loss of principal, and may not be suitable for all individuals. Before making any trading decisions, please consult with a qualified financial professional to understand the risks involved.
By using this script, you acknowledge and agree that any trading decisions are made solely at your discretion and risk.
Do not use this indicator on Heikin-Ashi, Renko, Kagi, Point-and-Figure, or Range charts, as these chart types can produce unrealistic results for signal markers and alerts.
Best regards and happy trading
Chervolino.

Fair Value Gaps (FVG)This indicator automatically detects Fair Value Gaps (FVGs) using the classic 3-candle structure (ICT-style).
It is designed for traders who want clean charts and relevant FVGs only, without the usual clutter from past sessions or tiny, meaningless gaps.
Key Features
• Bullish & Bearish FVG detection
Identifies imbalances where price fails to trade efficiently between candles.
• Automatic FVG removal when filled
As soon as price trades back into the gap, the box is deleted in real time – no more outdated zones on the chart.
• Only shows FVGs from the current session
At the start of each new session, all previous FVGs are cleared.
Perfect for intraday traders who only care about today’s liquidity map.
• Flexible minimum gap size filter
Avoid noise by filtering FVGs using one of three modes:
Ticks (based on market tick size)
Percent (relative to current price)
Points (absolute price distance)
• Right-extension option
Keep gaps extended forward in time or limit them to the candles that created them.
Why This Indicator?
Many FVG indicators overwhelm the chart with zones from previous days or tiny imbalances that don’t matter.
This version keeps things clean, meaningful, and real-time accurate, ideal for day traders who rely on market structure and liquidity.

RTH vs ETH Candle StylingRTH vs ETH Candle Styling — Clean Session-Based Candle Filters
This indicator restyles the chart’s candles based on session type:
🟩 RTH (Regular Trading Hours — 09:30 to 16:00 EST)
RTH candles display normal, full-color price action, showing momentum clearly during the primary US session.
⬛ ETH (Extended Hours Trading)
All ETH candles are converted into hollow, black-outline candles, with:
Transparent bodies
Black borders
Black wicks
This creates an immediate visual separation between overnight price action (ETH) and the high-liquidity RTH session—reducing noise and helping traders focus on true market structure.
🔥 Why Use This?
Cleaner chart during overnight chop
Easy to distinguish RTH orderflow from ETH drift
Enhances gap logic, session deviations, and liquidity mapping
Makes your main RTH setups stand out instantly
⚙ Inputs
Adjustable RTH session (default: 09:30–16:00 EST)
Adjustable timezone (default: America/New_York)
GLOBAL SETTINGS TO CHANGE-Change-settings-symbol-candles-uncheck all

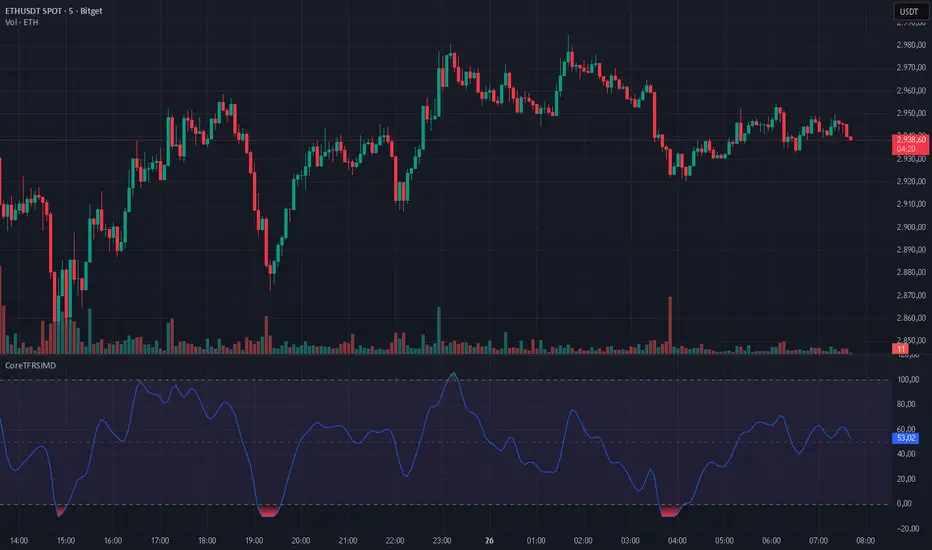
CoreTFRSIMD CoreTFRSIMD library — Reusable TFRSI core for consistent momentum inputs across scripts
The library provides a reusable exported function such as calcTfrsi(src, len, signalLen) so you can compute TFRSI in your own indicators or strategies, e.g. tfrsi = CoreTFRSIMD.calcTfrsi(close, 6, 2)
Summary
CoreTFRSIMD is a Pine Script v6 library that implements a TFRSI-style oscillator core and exposes it as a reusable exported function. It is designed for authors who want the same TFRSI calculation across multiple indicators or strategies without duplicating logic. The library includes a simple demo plot and band styling so you can visually sanity-check the output. No higher-timeframe sampling is used, and there are no loops or arrays, so runtime cost is minimal for typical chart usage.
Motivation: Why this design?
When you reuse an oscillator across different tools, small implementation differences create inconsistent signals and hard-to-debug results. This library isolates the signal path into one exported function so that every dependent script consumes the exact same oscillator output. The design combines filtering, normalization, and a final smoothing pass to produce a stable, RSI-like readout intended for momentum and regime context.
What’s different vs. standard approaches?
Baseline: Traditional RSI computed directly from gains and losses with standard smoothing.
Architecture differences:
A high-pass stage to attenuate slower components before the main smoothing.
A multi-pole smoothing stage implemented with persistent state to reduce noise.
A running peak-tracker style normalization that adapts to changing signal amplitude.
A final signal smoothing layer using a simple moving average.
Practical effect:
The oscillator output tends to be less dominated by raw volatility spikes and more consistent across changing conditions.
The normalization step helps keep the output in an RSI-like reading space without relying on fixed scaling.
How it works (technical)
1. Input source: The exported function accepts a source series and two integer parameters controlling responsiveness and final smoothing.
2. High-pass stage: A recursive filter is applied to the source to emphasize shorter-term movement. This stage uses persistent storage so it can reference prior internal states across bars.
3. Smoothing stage: The filtered stream is passed through a SuperSmoother-like recursive smoother derived from the chosen length. This again uses persistent state and prior values for continuity.
4. Adaptive normalization: The absolute magnitude of the smoothed stream is compared to a slowly decaying reference level. If the current magnitude exceeds the reference, the reference is updated. This acts like a “peak hold with decay” so the oscillator scales relative to recent conditions.
5. Oscillator mapping: The normalized value is mapped into an RSI-like reading range.
6. Signal smoothing: A simple moving average is applied over the requested signal length to reduce bar-to-bar chatter.
7. Demo rendering: The library script plots the oscillator, draws horizontal guide levels, and applies background plus gradient fills for overbought and oversold regions.
Parameter Guide
Parameter — Effect — Default — Trade-offs/Tips
src — Input series used by the oscillator — close in demo — Use close for general momentum, or a derived series if you want to emphasize a specific behavior.
len — Controls the responsiveness of internal filtering and smoothing — six in demo — Smaller values react faster but can increase short-term noise; larger values smooth more but can lag turns.
signalLen — Controls the final smoothing of the mapped oscillator — two in demo — Smaller values preserve detail but can flicker; larger values reduce flicker but can delay transitions.
Reading & Interpretation
The plot is an oscillator intended to be read similarly to an RSI-style momentum gauge.
The demo includes three reference levels: upper at one hundred, mid at fifty, and lower at zero.
The fills visually emphasize zones above the midline and below the midline. Treat these as context, not as standalone entries.
If the oscillator appears unusually compressed or unusually jumpy, the normalization reference may be adapting to an abrupt change in amplitude. That is expected behavior for adaptive normalization.
Practical Workflows & Combinations
Trend following:
Use structure first, then confirm with oscillator behavior around the midline.
Prefer signals aligned with higher-high higher-low or lower-low lower-high context from price.
Exits/Stops:
Use oscillator loss of momentum as a caution flag rather than an automatic exit trigger.
In strong trends, consider keeping risk rules price-based and use the oscillator mainly to avoid adding into exhaustion.
Multi-asset/Multi-timeframe:
Start with the demo defaults when you want a responsive oscillator.
If an asset is noisier, increase the main length or the signal smoothing length to reduce false flips.
Behavior, Constraints & Performance
Repaint/confirmation: No higher-timeframe sampling is used. Output updates on the live bar like any normal series. There is no explicit closed-bar gating in the library.
security or HTF: Not used, so there is no HTF synchronization risk.
Resources: No loops, no arrays, no large history buffers. Persistent variables are used for filter state.
Known limits: Like any filtered oscillator, sharp gaps and extreme one-bar events can produce transient distortions. The adaptive normalization can also make early bars unstable until enough history has accumulated.
Sensible Defaults & Quick Tuning
Starting values: length six, signal smoothing two.
Too many flips: Increase signal smoothing length, or increase the main length.
Too sluggish: Reduce the main length, or reduce signal smoothing length.
Choppy around midline: Increase signal smoothing length slightly and rely more on price structure filters.
What this indicator is—and isn’t
This library is a reusable signal component and visualization aid. It is not a complete trading system, not predictive, and not a substitute for market structure, execution rules, and risk controls. Use it as a momentum and regime context layer, and validate behavior per asset and timeframe before relying on it.
Disclaimer
The content provided, including all code and materials, is strictly for educational and informational purposes only. It is not intended as, and should not be interpreted as, financial advice, a recommendation to buy or sell any financial instrument, or an offer of any financial product or service. All strategies, tools, and examples discussed are provided for illustrative purposes to demonstrate coding techniques and the functionality of Pine Script within a trading context.
Any results from strategies or tools provided are hypothetical, and past performance is not indicative of future results. Trading and investing involve high risk, including the potential loss of principal, and may not be suitable for all individuals. Before making any trading decisions, please consult with a qualified financial professional to understand the risks involved.
By using this script, you acknowledge and agree that any trading decisions are made solely at your discretion and risk.
Do not use this indicator on Heikin-Ashi, Renko, Kagi, Point-and-Figure, or Range charts, as these chart types can produce unrealistic results for signal markers and alerts.
Best regards and happy trading
Chervolino
Dimagi72 Trend Suite (EMA/SMA + 52W + Cross Signals)Dimagi72 Trend Suite is an advanced trend analysis tool designed to give traders a clear picture of market direction, momentum, and major structural turning points.
It combines the most reliable long-term and short-term signals into one clean, easy-to-read indicator.
Features
• EMA9 & EMA21 for short-term momentum
• SMA50, SMA100, SMA200 for medium & long-term trend structure
• 52-Week High & Low levels for institutional support/resistance
• Golden Cross / Death Cross signals (SMA50 vs SMA200)
• Trend Strength Meter, shown directly on the chart
• Clean labels without clutter
• Designed for crypto, stocks, and forex on all timeframes (best on Daily)
How it works
The indicator measures alignment between EMAs and SMAs, tracks long-term institutional levels, and highlights major trend reversals through cross signals.
The Trend Strength Meter calculates a score from -4 to +4, making trend direction instantly visible.
Why use this indicator
This suite brings together the most widely used trend-following tools into one unified system.
It helps traders quickly determine when the market is bullish, bearish, or neutral — and when major reversals may be forming.
Best for:
Swing traders, long-term trend followers, crypto traders, and anyone who wants a clean visual overview of the trend without using multiple separate indicators.
Tags (use these to show up in search)
trend
ema
sma
trend-following
golden cross
death cross
momentum
trend strength
52 week high
crypto
stocks
market structure

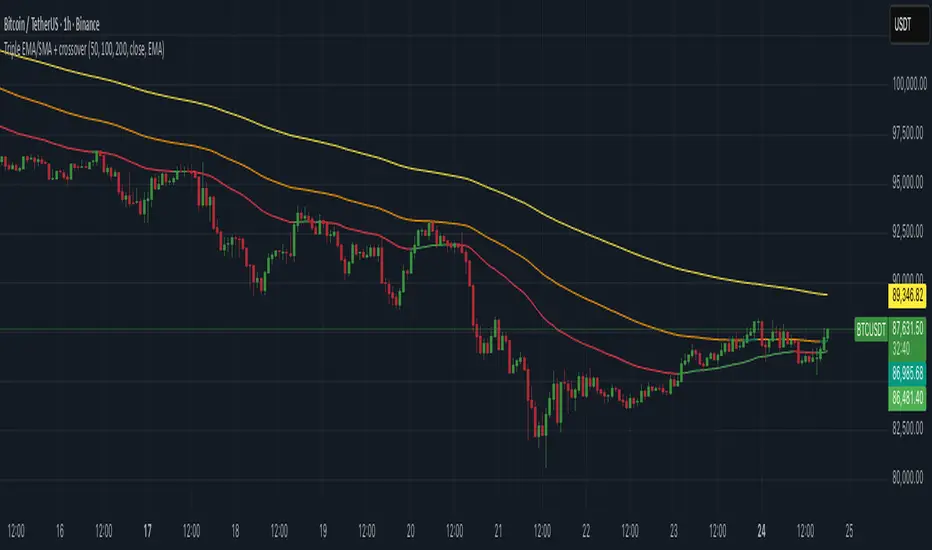
Triple EMA/SMA + crossoverA powerful 3-in-1 Moving Average system — clean, customizable, and built for real-time clarity.
This indicator combines three fully customizable moving averages into a single tool, giving you a complete view of trend behavior, momentum strength, and market structure — all in one compact and intuitive display.
Whether you prefer EMA or SMA, this script lets you switch seamlessly and adapt instantly to any trading style.
⸻
✅ Key Features
🔹 Three Moving Averages, One Indicator
Instead of cluttering your chart with multiple separate MAs, this script intelligently groups:
• MA1
• MA2
• MA3
…into a single, elegant indicator with unified settings and consistent visuals.
Each MA has its own:
• Length
• Rising/Falling/Flat dynamic color system
• Customizable colors
• Trend-based logic
This makes your chart cleaner, faster to read, and much more powerful.
⸻
🔹 Select Your MA Type
Switch all three MAs at once:
• EMA
• SMA
Perfect for testing different interpretations of trend behavior.
⸻
🔹 Advanced Trend Coloring
Each MA automatically adapts its color based on whether it is:
• Rising (uptrend)
• Falling (downtrend)
• Flat (consolidation / low momentum)
You decide the colors for each state — and for each MA individually.
⸻
🔹 MA Crossover Bar Highlights
When MA1 crosses MA2, the script highlights the exact bar with:
• White for bullish crossovers
• Purple for bearish crossovers
This makes trend shifts and potential reversals instantly visible, directly on price bars.
⸻
🔹 Source Flexibility
All three MAs can use any source series:
• Close, Open, HL2, HLC3, OHLC4, etc.
• Or any other series available on your chart
This gives you much more flexibility than standard MA indicators.
⸻
🔹 Beautiful, Clean & Fully Customizable
Every color — rising, falling, flat, crossover — can be changed.
All plots are clearly named (MA1, MA2, MA3) for easier control in the Style panel.
This script brings together:
• clarity
• flexibility
• and clean design
…into a compact, professional-grade indicator.
⸻
🎯 Why this Indicator Helps
You get the full power of three trend tools at once — but without the chart clutter.
Use it to:
• Spot early trend reversals
• Track short/mid/long-term structure simultaneously
• Identify momentum shifts in real time
• Visualize crossovers instantly
• Keep your chart clean and readable
It’s ideal for scalpers, day traders, swing traders, and anyone who wants a powerful yet simple way to read market conditions.
⸻
⚠️ Disclaimer
This script is for educational purposes only and does not constitute financial advice. Always do your own research before trading.
⸻
Fib+BOS/CHOCH+OB# ⭐ 1) **What This Indicator Does**
The indicator combines 4 major concepts:
### **1️⃣ Market Structure (Swing High/Low)**
* Detects major swing highs and lows using pivot logic
* Determines whether the market is **Bullish** or **Bearish**
### **2️⃣ BOS / CHOCH (Break of Structure / Change of Character)**
* **BOS:** continuation of trend
* **CHOCH:** early signal of trend reversal
* Only the **last 5** levels are displayed → keeps chart clean
### **3️⃣ Order Blocks (OB)**
* Detects last opposite candle before BOS/CHOCH
* Displays only **the latest 3 OB zones**
* Ideal for identifying high-probability pullbacks

Chop + MSS/FVG Retest (Ace v1.6) – IndicatorWhat this indicator does
Name: Chop + MSS/FVG Retest (Ace v1.6) – Indicator
This is an entry model helper, not just a BOS/MSS marker.
It looks for clean trend-side setups by combining:
MSS (Market Structure Shift) using swing highs/lows
3-bar ICT Fair Value Gaps (FVG)
First retest back into the FVG
A built-in chop / trend filter based on ATR and a moving average
When everything lines up, it plots:
L below the candle = Long candidate
S above the candle = Short candidate
You pair this with a higher-timeframe filter (like the Chop Meter 1H/30M/15M) to avoid pressing the button in garbage environments.
How it works (simple explanation)
Chop / Trend filter
Computes ATR and compares each bar’s range to ATR.
If the bar is small vs ATR → more likely CHOP.
If the bar is big vs ATR → more likely TREND.
Uses a moving average:
Above MA + TREND → trendLong zone
Below MA + TREND → trendShort zone
MSS (Market Structure Shift)
Uses swing highs/lows (left/right bars) to track the last significant high/low.
Bullish MSS: close breaks above last swing high with displacement.
Bearish MSS: close breaks below last swing low with displacement.
Those events are marked as tiny triangles (MSS up/down).
A MSS only stays “valid” for a certain number of bars (Bars after MSS allowed).
3-bar ICT FVG
Bullish FVG: low > high
→ gap between bar 3 high and bar 2 low.
Bearish FVG: high < low
→ gap between bar 3 low and bar 2 high.
The indicator stores the FVG boundaries (top/bottom).
Retest of FVG
Watches for price to trade back into that gap (first touch).
That retest is the “entry zone” after the MSS.
Final Long / Short condition
Long (L) prints when:
Recent bullish MSS
Bullish FVG has formed
Price retests the bullish FVG
Environment = trendLong (ATR + above MA)
Not CHOP
Short (S) prints when:
Recent bearish MSS
Bearish FVG has formed
Price retests the bearish FVG
Environment = trendShort (ATR + below MA)
Not CHOP
So the L/S markers are “model-approved entry candles”, not just any random BOS.
Inputs / Settings
Key inputs you’ll see:
ATR length (chop filter)
How many bars to use for ATR in the chop / trend filter.
Lower = more sensitive, twitchy
Higher = smoother, slower to change
Max chop ratio
If barRange / ATR is below this → treat as CHOP.
Min trend ratio
If barRange / ATR is above this → treat as TREND.
Hide MSS/BOS marks in CHOP?
ON = MSS triangles disappear when the bar is classified as CHOP
Keeps your chart cleaner in consolidation
Swing left / right bars
Controls how tight or wide the swing highs/lows are for MSS:
Smaller = more sensitive, more MSS points
Larger = fewer, more significant swings
Bars after MSS allowed
How many bars after a MSS the indicator will still allow FVG entries.
Small value (e.g. 10) = MSS must deliver quickly or it’s ignored.
Larger (e.g. 20) = MSS idea stays “in play” longer.
Visual RR (for info only)
Just for plotting relative risk-reward in your head.
This is not a strategy tester; it doesn’t manage positions.
What you see on the chart
Small green triangle up = Bullish MSS
Small red triangle down = Bearish MSS
“L” triangle below a bar = Long idea (MSS + FVG retest + trendLong + not chop)
“S” triangle above a bar = Short idea (MSS + FVG retest + trendShort + not chop)
Faint circle plots on price:
When the filter sees CHOP
When it sees Trend Long zone
When it sees Trend Short zone
You do not have to trade every L or S.
They’re there to show “this is where the model would have considered an entry.”
How to use it in your trading
1. Use it with a higher-timeframe filter
Best practice:
Use this with the Chop Meter 1H/30M/15M or some other HTF filter.
Only consider L/S when:
Chop Meter = TRADE / NORMAL, and
This indicator prints L or S in the right location (premium/discount, near OB/FVG, etc.)
If higher-timeframe says NO TRADE, you ignore all L/S.
2. Location > Signal
Treat L/S as confirmation, not the whole story.
For shorts (S):
Look for premium zones (previous highs, OBs, fair value ranges above mid).
Want purge / raid of liquidity + MSS down + bearish FVG retest → then S.
For longs (L):
Look for discount zones (previous lows, OBs/FVGs below mid).
Want stop raid / purge low + MSS up + bullish FVG retest → then L.
If you see L/S firing in the middle of a bigger range, that’s where you skip and let it go.
3. Instrument presets (example)
You can tune the ATR/chop settings per instrument:
MNQ (noisy, 1m chart):
ATR length: 21
Max chop ratio: 0.90
Min trend ratio: 1.40
Bars after MSS allowed: 10
GOLD (cleaner, 3m chart):
ATR length: 14
Max chop ratio: 0.80
Min trend ratio: 1.30
Bars after MSS allowed: 20
You can save those as presets in the TV settings for quick switching.
4. How to practice with it
Open replay on a couple of days.
Check Chop Meter → if NO TRADE, just observe.
When Chop Meter says TRADE:
Mark where L/S printed.
Ask:
Was this in premium/discount?
Was there SMT / purge on HTF?
Did the move actually deliver, or did it die?
Screenshot the A+ L/S and the ugly ones; refine:
ATR length
Chop / trend thresholds
MSS lookback
Your goal is to get it to where:
The L/S marks show up mostly in the same places your eye already likes,
and you ignore the rest.

Advanced Triple Strategy ScalperHere are the three scalping strategies presented in the video "3 Scalping Strategies That Work Every Day (Backtested & Proven)" by Asia Forex Mentor – Ezekiel Chew:
### Scalper’s Trend Filter (Triple EMA)
This strategy uses three EMAs (25, 50, 100) on the 5-minute chart to filter high-probability trades aligned with momentum .
- Only trade when all three EMAs are angled in the same direction and clearly separated (no crossing or tangling) .
- Enter when price pulls back toward the 25 or 50 EMA and then bounces back toward the 25 EMA, but do not enter if price closes below the 100 EMA .
- Set stop-loss just below the 50 EMA or swing low and aim for a risk-to-reward ratio of 1:1.5 .
### Flip Zone Trap (Reversal Catching)
This method identifies precise reversal moments where market structure shifts from weakness to strength .
- Use the 15-min chart to locate key support or resistance zones where price previously reacted .
- Wait for price to stop making lower lows and begin making higher highs (or vice versa for shorts); confirm with a trendline break AND follow-through (higher lows & highs within 5-7 candles) .
- Use confirmation candles (bullish engulfing, pin bar rejection) at the zone before entry .
### Liquidity Shift Trigger (Smart Money Trap)
This system leverages institutional stop hunts and liquidity sweeps at key zones for sniper entries .
- Start with a 15-min chart to identify structure breaks and points of interest (order blocks, flip zones, demand zones) .
- Drop to 1-min chart and wait for price to enter the refined zone and sweep liquidity (sharp wick/spike below/above key level) .
- Once liquidity is swept, wait for a clean structure shift (break of most recent internal high or low) within 5–6 candles—if confirmed, refine entry to the candle that caused the break and enter when price returns to that candle with a strong reaction .
***
### Practical Application
- These strategies are systematic, rule-based, and designed to cut out fake moves, avoid early stop-outs, and align entries with momentum and institutional activity .
- Perfect for short timeframes and volatile pairs like XAUUSD, especially if paired with additional confirmation from other technical analysis tools .
All three strategies emphasize filtering noise, waiting for momentum/trend confirmation, and avoiding impulsive entries—key principles for consistent scalping success

BTC BRD – Bullet-Proof Reversal DetectorThis indicator identifies true market reversals by analyzing raw price structure instead of traditional lagging indicators. It tracks how Bitcoin (and any crypto asset) naturally shifts direction by detecting confirmed swing points, followed by a structural break in the opposite direction. A bullish signal appears when price forms a higher low and then breaks above the previous structural high; a bearish signal forms when price creates a lower high followed by a break below the previous structural low.
Because it uses pure market structure, every signal reflects an actual change in trend direction, not a temporary pullback or indicator noise. This makes the tool highly reliable across all timeframes — from 1 minute scalping to multi-hour swing setups. The result is a clean, noise-free view of where the market truly reverses, giving traders clear confirmation points to plan entries, exits, or risk management.

Smart Margin Zone
SMART MARGIN ZONE - CME-BASED SUPPORT & RESISTANCE INDICATOR
TITLE FOR PUBLICATION:
Smart Margin Zone - CME Margin-Based Support and Resistance
CATEGORY:
Support and Resistance
SHORT DESCRIPTION (for preview):
Automatically plots margin zones based on CME Group requirements. These zones represent critical price levels where leveraged traders face margin calls, creating natural support and resistance through forced liquidations.
═══════════════════════════════════════════════════════════════
FULL DESCRIPTION FOR TRADINGVIEW:
═══════════════════════════════════════════════════════════════
📊 Smart Margin Zone - Professional Trading Zones Based on CME Data
This indicator automatically calculates and displays margin zones derived from official CME Group margin requirements. These zones represent critical price levels where traders using leverage receive margin calls, triggering forced position closures that create natural support and resistance levels.
═══════════════════════════════════════════════════════════════
🎯 CORE CONCEPT
═══════════════════════════════════════════════════════════════
When price reaches calculated margin zones, traders using 2:1 or 4:1 leverage on CME futures receive margin calls. Brokers automatically liquidate these positions, creating waves of buying or selling pressure that form strong support and resistance levels.
This is not theoretical - it's based on actual margin requirements from CME Group, the world's largest derivatives marketplace.
═══════════════════════════════════════════════════════════════
📐 CALCULATION METHODOLOGY
═══════════════════════════════════════════════════════════════
The indicator uses the following formula to calculate zone sizes:
Zone Size = (Margin Requirement / Tick Value) × Tick Size × 1.10
Where:
• Margin Requirement = Official CME initial margin (updated November 2024)
• Tick Value = Dollar value of minimum price movement
• Tick Size = Minimum price increment
• 1.10 = 10% buffer for realistic zone width
SUPPORTED INSTRUMENTS WITH CME DATA:
Currency Pairs:
• EURUSD: $2,100 margin → 0.0168 zone size
• GBPUSD: $1,800 margin → 0.0144 zone size
• AUDUSD: $1,300 margin → 0.0065 zone size
• NZDUSD: $1,100 margin → 0.0055 zone size
• USDJPY: $3,200 margin → custom calculation
• USDCAD: $950 margin → calculated
• USDCHF: $1,650 margin → calculated
Commodities:
• Gold (XAUUSD): $8,000 margin → 80 points zone size
• Silver (XAGUSD): $6,500 margin → calculated
• WTI Crude Oil: $4,500 margin → calculated
═══════════════════════════════════════════════════════════════
🔍 HOW IT WORKS
═══════════════════════════════════════════════════════════════
1. SWING POINT DETECTION
The indicator automatically identifies swing highs and swing lows using a configurable lookback period (default 10 bars). These become anchor points for zone calculations.
2. FIVE ZONE LEVELS
From each swing point, five zone levels are calculated:
• Zone 1/4 (25%) - First correction level
• Zone 1/2 (50%) - KEY ZONE for trend determination
• Zone 3/4 (75%) - Intermediate level
• Zone 1/1 (100%) - Full margin zone (strongest level)
• Zone 5/4 (125%) - Extended zone
3. TREND IDENTIFICATION
• Close above Zone 1/2 resistance = Bullish trend
• Close below Zone 1/2 support = Bearish trend
• Between zones = Range/consolidation
4. HISTORICAL CONTEXT
Current zones are displayed prominently with fills and labels. Historical zones appear as thin, semi-transparent lines for context without cluttering the chart.
═══════════════════════════════════════════════════════════════
⚙️ FEATURES
═══════════════════════════════════════════════════════════════
AUTOMATED CALCULATION:
✅ Auto-detection of swing highs and lows
✅ Real-time zone updates as new swings form
✅ CME margin data built-in for major instruments
✅ Manual override option for custom calculations
VISUAL CLARITY:
✅ Color-coded zones (red=resistance, green=support)
✅ Adjustable transparency for fills and lines
✅ Current zones bold with fills and price labels
✅ Historical zones thin and transparent
✅ Swing point markers show calculation origins
CUSTOMIZATION:
✅ Show/hide individual zone levels (1/4, 1/2, 3/4, 1/1, 5/4)
✅ Toggle historical zones on/off
✅ Adjustable lookback period (5-50 bars)
✅ Customizable colors for all elements
✅ Line width and transparency controls
✅ Zone extension options (none/right/both)
TREND ANALYSIS:
✅ Optional trend background coloring
✅ Customizable trend colors and transparency
✅ Real-time trend identification display
STATISTICS:
✅ Live statistics table showing:
- Current instrument
- Active zone size
- Calculation mode
- Current trend direction
- Number of zones displayed
ALERTS:
✅ Zone 1/2 breakout (up/down)
✅ Full margin zone 1/1 reached
✅ Customizable alert messages
═══════════════════════════════════════════════════════════════
📈 TRADING APPLICATIONS
═══════════════════════════════════════════════════════════════
ENTRY SIGNALS:
• Bounces from zone levels = potential entry points
• Zone 1/2 breakouts = trend continuation entries
• Zone rejections = reversal opportunities
RISK MANAGEMENT:
• Zone levels = logical stop-loss placement
• Zone 1/1 = maximum risk level
• Zone spacing = position sizing guide
PROFIT TARGETS:
• Next zone level = first target
• Zone 1/1 = full profit target
• Zone breakouts = extended targets
TREND CONFIRMATION:
• Price above Zone 1/2 resistance = confirmed uptrend
• Price below Zone 1/2 support = confirmed downtrend
• Consolidation between zones = wait for breakout
═══════════════════════════════════════════════════════════════
📚 USAGE INSTRUCTIONS
═══════════════════════════════════════════════════════════════
GETTING STARTED:
1. Add indicator to chart of any supported instrument
2. Zones automatically calculate and display
3. Adjust swing detection period if needed (default 10 works well)
4. Customize colors and visibility to your preference
OPTIMAL SETTINGS:
• Best timeframes: H1, H4, Daily, Weekly
• Default swing length (10) suitable for most markets
• Show 2-3 historical zones for context
• Enable swing point markers to see calculation origins
INTERPRETATION:
• Watch for price reactions at zone boundaries
• Strong bounces = respect for margin level
• Clean breaks = momentum continuation
• Multiple touches = zone strength confirmation
SET ALERTS:
• Zone 1/2 breakouts for trend entries
• Zone 1/1 reaches for profit-taking
• Custom alerts for your specific strategy
═══════════════════════════════════════════════════════════════
⚠️ IMPORTANT NOTES
═══════════════════════════════════════════════════════════════
DATA ACCURACY:
• CME margin requirements updated November 2024
• Margins change periodically - check CME Group website
• Manual mode available for latest margin data
• Indicator provides analysis tool, not financial advice
STATISTICAL PERFORMANCE:
• Historical data shows >60% probability of continued movement after Zone 1/2 breakout
• Zone effectiveness varies by market conditions
• Best results in trending markets with clear swings
LIMITATIONS:
• Margin requirements change - monitor CME updates
• Works best on liquid instruments with clear swings
• Not a standalone trading system
• Should be combined with additional analysis
═══════════════════════════════════════════════════════════════
🔧 METHODOLOGY CREDIT
═══════════════════════════════════════════════════════════════
This indicator is based on the margin zones concept developed by Alexander Bazylev (BTrade indicator for MetaTrader platforms).
The TradingView implementation has been completely rewritten with original enhancements:
• Multiple zone levels instead of single level
• Automatic swing point detection algorithm
• Direct CME data integration
• Historical zone visualization
• Advanced customization options
• Comprehensive statistics and alerts
All code is original and specifically designed for TradingView's Pine Script v5 environment.
═══════════════════════════════════════════════════════════════
💡 BEST PRACTICES
═══════════════════════════════════════════════════════════════
COMBINE WITH:
• Volume analysis for confirmation
• Trend indicators for direction bias
• Price action patterns at zones
• Higher timeframe analysis
AVOID:
• Trading against strong trends at minor zones
• Over-leveraging based solely on zone placement
• Ignoring broader market context
• Expecting perfect bounces every time
OPTIMIZE:
• Adjust swing length for different timeframes
• Shorter period (5-7) for intraday trading
• Longer period (15-20) for swing trading
• Test historical effectiveness on your instruments
═══════════════════════════════════════════════════════════════
📖 EDUCATIONAL VALUE
═══════════════════════════════════════════════════════════════
This indicator helps traders understand:
• How institutional margin requirements affect price
• Where forced liquidations create pressure
• Natural support and resistance formation
• Relationship between leverage and price levels
• Market structure and key technical levels
═══════════════════════════════════════════════════════════════
🔄 VERSION HISTORY
═══════════════════════════════════════════════════════════════
Version 1.0 (Initial Release):
• CME-based zone calculation for 10 instruments
• Automatic swing high/low detection
• 5 zone levels with customizable display
• Historical zones with transparency control
• Swing point markers
• Trend background indicator
• Live statistics table
• Multiple alert conditions
• Fully customizable colors and styles
• English language interface
═══════════════════════════════════════════════════════════════
📞 SUPPORT & FEEDBACK
═══════════════════════════════════════════════════════════════
Questions or suggestions? Leave a comment below!
If you find this indicator useful:
⭐ Please leave a like
💬 Share your experience in comments
🔔 Follow for updates and new indicators
═══════════════════════════════════════════════════════════════
⚖️ DISCLAIMER
═══════════════════════════════════════════════════════════════
This indicator is provided for educational and analytical purposes only. It is not financial advice and should not be the sole basis for trading decisions.
• Past performance does not guarantee future results
• Trading involves substantial risk of loss
• CME margin requirements subject to change
• Always do your own research and risk management
• Consult a financial advisor for investment advice
The creator is not responsible for any trading losses incurred through use of this indicator.
